select * from logs;
Open source SIEM for instant log insights, powered by DuckDB. Analyze millions of events in seconds, right from your terminal.
Fall in love with blazing fast log analysis, and stay for our incredible community!
- Hey Team ... Special thanks to @Ved for helping with multiple connection setup. Kudos to the team for amazing work. 👏 🎉
 Sandeep Kumar PatroSlack Community Member
 - Developers, maintainers, and even the CEO are all more than willing to dive into any issue or problem.
 Graza AnderssonOpen Source Contributor
 - Hi Team. just want to tell you guys that you are doing good work. I really like the dashboard and the compliance package.
 Rasyid DahbulSlack Community Member
 - 👏 This is beyond amazing!
 RyanSlack Community Member
 - Hi, sorry for the late response but I finally figured out the what the issues was... thank you very much for your awesome support as usual
 Dominik BermühlerSlack Community Member
 - Everyone is so friendly and helpful, I love being part of this community.
 Ellis ValentinerLead Data Scientist - Virtual Facility
 - We are actively involved (and happy to publish and share plugins) due to the excellent support and engagement from the community.
 APS GroupOpen Source Contributors
Features
Hunt threats with open-source SIEM tooling
Cloud logs, SQL insights
Tailpipe collects logs from cloud, container and application sources. Query and analyze your data instantly with the power of SQL, right from your terminal.

Fast, local, and efficient
Tailpipe runs locally, powered by DuckDB's in-memory analytics and Parquet's optimized storage. Delivering high performance at low cost, it scales to handle massive datasets without expensive infrastructure.

An ecosystem of prebuilt intelligence
Get started fast with Powerpipe mods: MITRE ATT&CK-aligned queries, prebuilt detections, benchmarks, and dashboards. Open source and community-driven, Tailpipe comes ready with hundreds of examples to supercharge your analysis.

Built to build with
Define detections as code, extend functionality with plugins and write custom SQL queries. Tailpipe is open source and designed for developers to adapt, extend and make it their own.
Use Cases
Insights across Security, Performance, and Cost
Are there repeated failed login attempts?
Threat HuntingWhat resources were touched in the last hour?
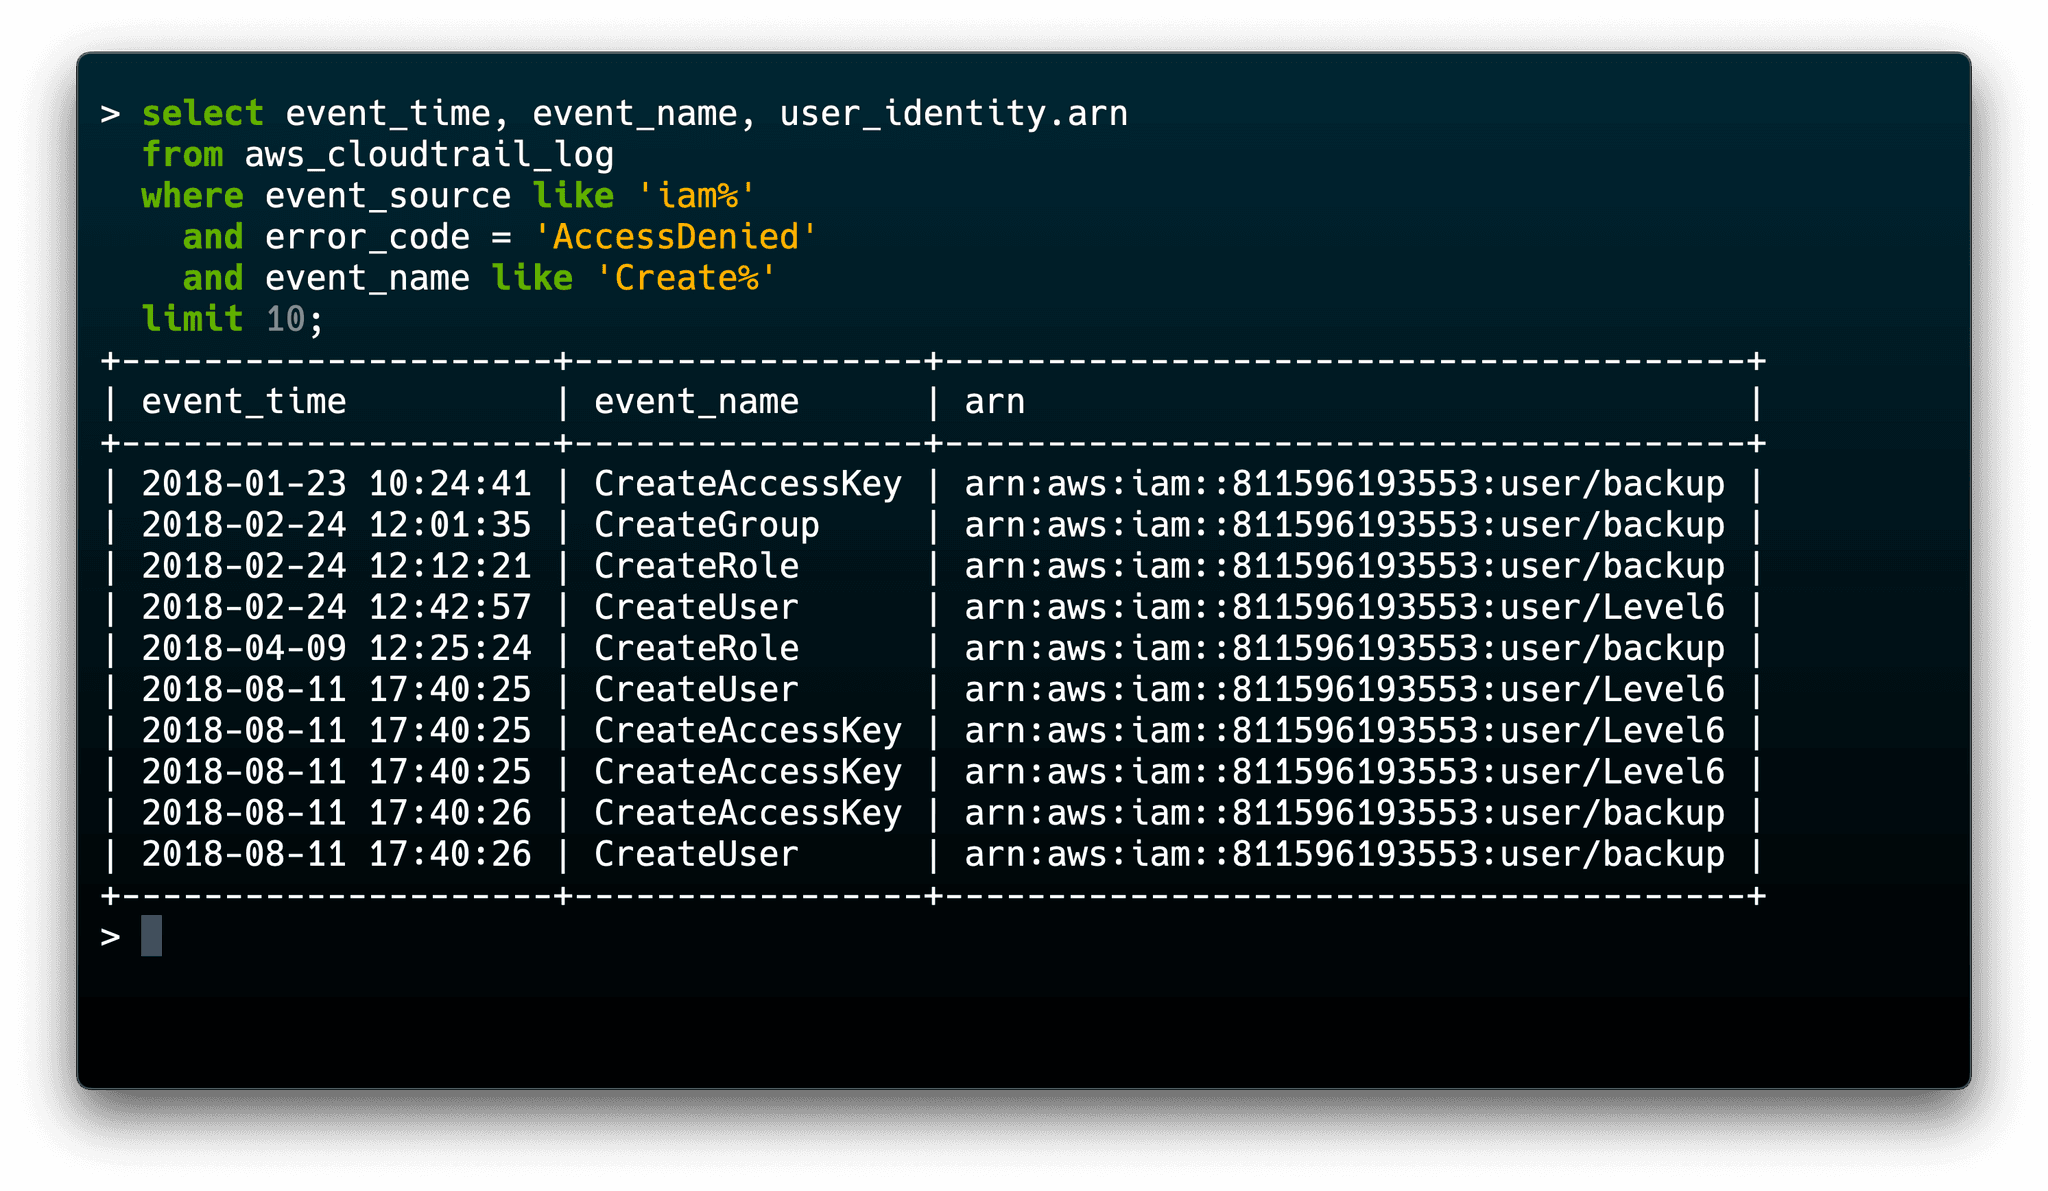
Change AuditWhat recent IAM changes have been made?
Security AuditWhere are critical events originating from?
Geolocation QueriesHow It Works
Get started analyzing logs in <60sec.
Get inspired
Explore dozens of open source libraries and examples on the Tailpipe Hub.
Get started fast
Install Tailpipe & your favorite cloud service plugins locally.
Collect your logs
Tailpipe can collect logs directly to your local device from source APIs, object storage or network locations.
Explore your log data
Understand the size and shape of your logs to get a feel where to start.
Dig deeper with SQL
SQL eliminates friction between you and your data. Query, sort, group and filter using familiar SQL syntax.
Detections as code with Powerpipe
Go even deeper with Powerpipe. Run (and learn from) existing industry benchmarks & MITRE ATT&CK detections then start building your own as code.

Collaborate
Organize your analysis into code repos to share what you are building with your teams and our growing community.
Demos
See Tailpipe in Action


select * from logs;
Open source SIEM for instant log insights, powered by DuckDB. Analyze millions of events in seconds, right from your terminal.


Dashboards for DevOps.
Visualize cloud configurations. Assess security posture against a massive library of benchmarks. Build custom dashboards with code.

select * from cloud;
Drill deep into the table schemas and discover helpful example queries for 140 plugins.


Workflow for DevOps.
Automate cloud operations. Coordinate people and pipelines. Build workflows as code.